
Inflationary Pricing: Surviving the Profitability Crunch

The short story
Double-digit inflation during 2022 has reset the CPG pricing landscape.
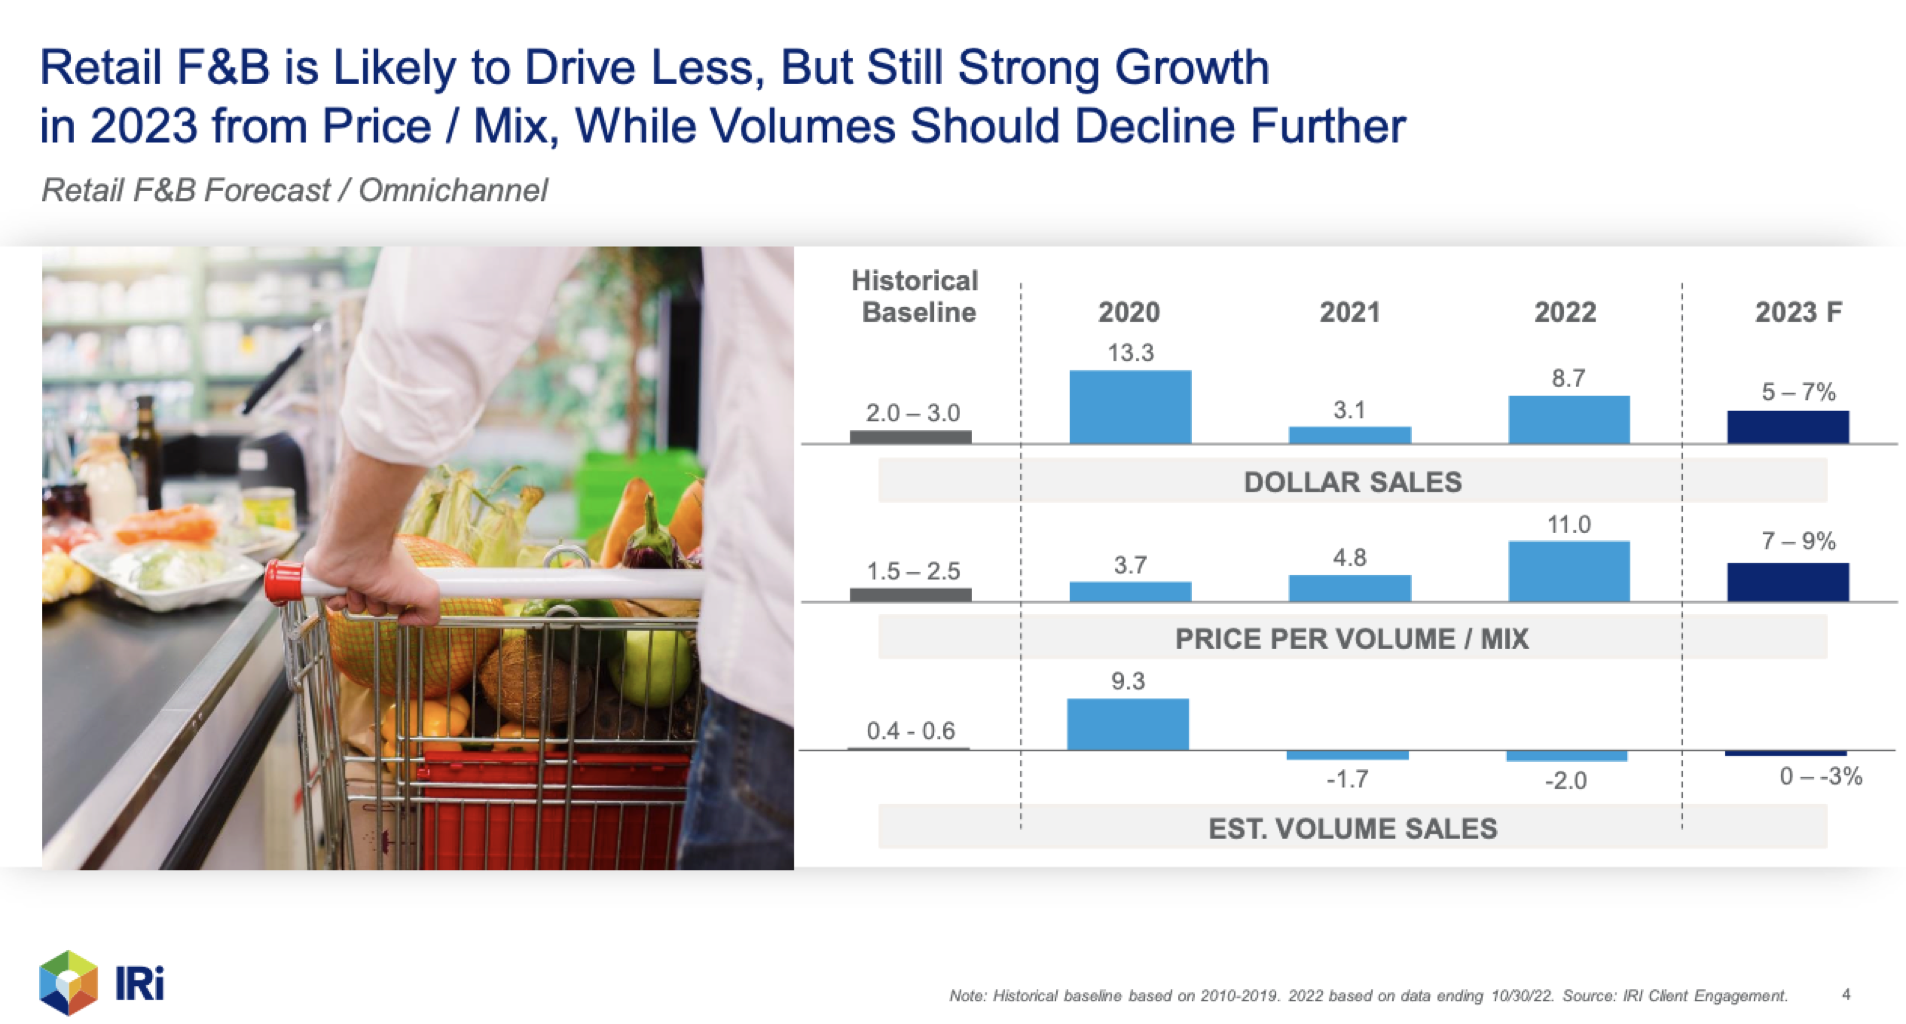
For 2023, IRI is forecasting that retail food and beverage prices will rise in the 7 - 9% range with sales volumes impacts of 0 to -3%. Depending on your current operating margin % level, and your ability to absorb all your unit resource price increases, your 2023 operating profit Dollars could still decline by -30% or more.
This article presents a case study to illustrate how pricing and elasticity impact margins. It also highlights how inflationary periods accentuate the need to manage tough pricing trade-offs and the imperative to double-down on extracting efficiency gains.
Pricing increases are here to stay

Inflation News Snippets (Sep-Nov, 2022)
The direct financial impact of inflation on our daily home, social and work lives is evident and in many cases significant.
Politicians, as you would expect, are predicting an early end to inflation. Financial analysts, economists, pricing experts and business leaders, however, are forecasting some moderation within the short-term. The astute experts are signaling a longer period of inflation.
In November 2022, Bloomberg reported the following:
“A cooling in US consumer prices offered cheer to households, investors and Federal Reserve officials, but there’s still a long way before high inflation becomes history.
At 7.7%, annual inflation in October was the slowest since January -- before the start of Russia’s war in Ukraine that triggered a worldwide surge in commodities and pump prices. Even more importantly for the Fed, a closely watched measure that excludes food and energy decelerated by more than economists anticipated.
(Reade Pickert & Augusta Sariava, Bloomberg.com, Nov 10, 2022)
Hermann Simon, considered the world’s leading authority on pricing, and expert Adam Echter of Simon-Kucher & Partners, express the following in their recent publication:
“After a decade of unusual price stability, we are experiencing the highest rates of price increases since the 1970s. There is much to suggest that inflation will be with us for years to come.”
(Hermann Simon & Adam Echter; Beating Inflation; Springer International Publishing, Nov 2022)
Kroger’s CEO, Rodney McMullen, shared the following beliefs on an inflation slowdown:
“We are starting to cycle inflation from last year, so it’s starting to slow down a little bit,” McMullen explained. “Our hope and expectation as we get to early next year is that we’ll see it continue to decrease a little bit.”
(Interview with Michael Straha, Good Morning America’ As reported by Emily Crowe, Progressive Grocer, Nov 22, 2022 )
The key statement in McMullen’s belief is “continue to decrease a little bit”. Even a little bit, lets say from 12% to 10% or to 8% still represents a significant level of inflation. And, with small declines, it will take a long time to get to pre-2020 levels.
Price Recovery: A key inflationary relationship
In many quarterly financial reports we observe double digit sales increases. Most of these are driven by relatively larger double-digit price increases that offset single-digit volume decreases. It is not unusual to also see double-digit profitability gains for some companies in certain categories and for companies in certain parts of the supply chain.
Why are some companies reporting record year-on-year profits while other companies are in decline or facing ruin?

Price Recovery
To explore pricing dynamics during periods of high inflation it is useful to look at Price Recovery, which defines the relationship between product unit price and the unit price of resources that constitute that product.
Price Recovery is a measure of the organization’s ability or choice to change product prices faster or slower than the change in variable and fixed resource unit prices that are negotiated with or that are imposed by suppliers.
When your product price increases at a faster rate than your unit resource prices, you are exhibiting price over-recovery. When product price increases at a slower rate than unit resource price, you are exhibiting price under-recovery.
As the case study in this article will show, operating profit can increase when you price over-recover even if volumes decline by a much lesser amount. Operating profit can decrease when you price under-recover and when volumes simultaneously decline by even a much lesser amount.
If you are price over-recovering, are you fleecing the consumer or are you leveraging brand and pricing power? Are too many companies using the opportunity to reset the base price, given that shoppers and shoppers now “expect” higher prices?
Price elasticity impacts food and beverage categories
October 2022 data (vs 2021), released by IRI, highlights the following for different food and beverage categories :
Price inflation, as experienced by shoppers, and
Volume declines, due to price elasticity, brand/channel switching and likely consumption declines.
Across the U.S. food and beverage categories monitored, the average price inflation of 13.3% in October 2022 was counteracted by a sales volume decline of -2.7%. As noted by IRI, price inflation and volume changes varied by category.

Source: Tracking Retail Food and Beverage Inflation,, IRI Report, IRI, Nov 1, 2022
The prices and volumes are Dollar-weighted category averages. Sub-categories and individual brands within those categories can thus exhibit consumer price and volume changes that are lower or higher than these category averages.
A brand-owner company whose brands span a number of categories will thus experience overall price and volume elasticity impacts that are aggregated from all their brands and SKUS in different categories and geographies.
For example, Kraft Heinz reported the following for their 2022 Q3 results:
“Organic Net Sales increased 11.6 percent versus the prior year period. Price increased 15.4 percentage points versus the prior year period, with growth in both reportable segments that was primarily driven by price increases to mitigate rising input costs.
Volume/mix declined 3.8 percentage points versus the prior year period, with declines in both reportable segments that were primarily driven by supply constraints and elasticity impacts from pricing actions.”
Most of Kraft Heinz’s business is in the US, so on an an illustrative basis you could contextualize their 15.4% price increase and -3.8 % volume/mix decrease with IRI’s Shelf Stable Meals & Ingredients category results of a 17.3% price increase and a -3.9% volume sales decrease.
Large brands are also feeling the big squeeze
For the 3 months ended Sep 24 2022, Kraft Heinz reported an operating profit decline of 35%. As per their own commentary, results were impacted, amongst other reasons, by “unfavorable changes in other expenses”.

My own kwik ‘n dirty analyses shows that if their “organic” price increase of 15.4% had increased to match equivalent inflationary increases in COGS, freight and MG&A expenses, then their organic operating income would have actually increased by just below 10%.
The complexity of Kraft Heinz’s global business and other operating environment challenges, one-off costs, acquisitions and divestitures also impacted costs for Q3, which then contributed to the overall 35% operating profit decline.
It is also possible that COGS, freight and MG&A unit price expenses increased by more than 15.4%. In this case Kraft Heinz might not have been able to pass that level of increase to distributors, retailers and ultimately to shoppers and consumers. Or, they might have deliberately chosen to increase prices at a smaller rate versus competitors. Either way, this means that Kraft Heinz would have price under-recovered and that would have yielded a profitability impact.
The question that then should be posed is the following: How much worse would Kraft Heinz’s operating profitability decline have been, if prices had not increased significantly?
Large CPG companies, like Kraft Heinz, conduct sophisticated pricing and volume elasticity analyses on an ongoing basis. They price recovery choices they deliberately make or are able to make, across hundreds if not thousands of SKUs in many geographies is based on their own competitive circumstances and goals. Leading CPG brands do however set the price increase parameters that then influences other competitors in those categories.
The scale of large CPG brands and companies also allows them to deliver operating margin % levels that are much higher than the margins of emerging CPG brands. Kraft Heinz’s operating margin % for 2022 Q3 was about 18% of net sales. Many emerging CPG brands are likely to find themselves in the low to mid single digits and even in negative margin territory if you are a startup brand.
The point here is that inflationary times often expose the fragility of the core drivers of sustainable profitable growth. These include brand strength, pricing power, efficiency extraction potential and supply chain agility.
How does price recovery and elasticity impact profit?
Subsequent sections in this article use an illustrative case study to explore how different inflationary price increases and elasticity-based volume declines impact the operating profit of a company. The analyses focuses on whether a brand can get back to pre-inflationary margin levels.
The illustrative case study will also explore operating profit impacts if we use IRI’s November 2022 forecast for inflationary price increases and their expected volume decline ranges for 2023. Off course, it must be noted that different categories and different brands will exhibit different price elasticity behaviors.
As you would expect, brands and companies with low operating margins are much more sensitive and volatile to pricing and volume changes. Especially during inflationary periods. As you will observe in the subsequent sections of this article, the same price and volume changes for a brand with a low operating margin % and for a brand with a higher operating margin % yields significantly different changes in operating margin dollars between two periods.
Note: For the case study we use Operating Profit (Dollars) and Operating Margin % of Net Sales as opposed to EBITDA, so that the analog with Kraft Heinz’s reported results could be used. Using EBITDA would provide better decision-making insights with respect to analyzing the cash impact of inflationary and elasticity changes. Net Profit and even Economic Profit can also be used.
What happened in Shelf-Stable Meals & Ingredients?
For the illustrative case study, we will explore how a brand’s operating profit would have been impacted if it had exhibited price (at retail) and volume decline changes that mirrored the October 2022 category changes as reported by IRI.

Source: Tracking Retail Food and Beverage Inflation,, IRI Report, IRI, Nov 1, 2022
The brand (fictitious name), Ellie’s Farmhouse Ketchup, is an emerging CPG brand whose core ingredients are grown and processed at the new co-op plant adjoining the farm. Ellie’s, had shown promising double-digit growth in the previous four years and is available in over 3,000 stores.
For 2021, Ellie’s achieved an operating margin level of 5% (of net sales) and has a decent gross margin in the mid 40% range. Ellie’s is positioned at a competitive price relative to Heinz and spends about 15% of gross sales on trade marketing activities. For purposes of the charts used in this case study, the 2021 operating profit Dollars for Ellie’s are “normalized” to $1,000.

Operating profit impact: No price and no volume change
Like many CPG brands, Ellie’s Farmhouse Ketchup experienced unprecedented unit resource price increases in 2022. The price of energy used in the hot-houses increased significantly. Labor shortage volatility had to be mitigated by a large jump in pay and benefit rates. This was necessary to retain core staff and to recruit new talent needed to expand the growing business.
COGS, Freight and MG&A unit resource prices had increased by 17% in 2022. Had retail pricing and wholesale pricing remained the same in 2022, and had Ellie’s achieved the same levels of volume sales as in 2021, the resource price increases would have yielded an operating profit loss of about -$2,000. The operating margin would have declined from 5% of net sales to -10% of net sales.
Refer to the following articles on CPG gross margin and sales contribution, for a more comprehensive discussion of how these measures are often miscalculated or misinterpreted.
Prices rise to mitigate inflation but volumes drop

Operating profit impact: 17% price and -4% volume change
The 300% decline in operating profit Dollars, from 2021 to 2022, would have obviously been an untenable situation for Ellie’s. Like many established and emerging CPG brands during 2022 in the category, Ellie’s Farmhouse Ketchup increased the suggested retail price (SRP) by 17%. This was done in conjunction with its distributor and retail customers.
The distributors and retailers maintained their own gross margin percentages and Ellie’s maintained its trade marketing spend at 15% of gross sales. The net effect was that Ellie’s was also able to increase its own price-to-distributor by 17%.
The price increase of 17% for Ellie’s Farmhouse Ketchup, however also yielded a -4% drop in volume for 2022, as shoppers and consumers sought cheaper options or even purchased and used less.
A drop in volume as prices increase, depicts the price elasticity of the brand. This dynamic is experienced by many brands in a category when prices are raised and is amplified during inflationary times as shopper disposable income gets squeezed. Depending on the category, very strong brands can maintain volume and perhaps even growth trajectories. Value brands, including private label brands, can increase volume as shoppers and consumers switch brands and channels.
For Ellie’s, the 17% price increase which was offset by a -4% drop in volume during 2022, yielded an operating profit of $950 at an operating margin of just over 4%.
As you will observe later, it is not unusual for brands with operating profit margins of above 5% to be able to get close to, or maintain or even surpass a previous year’s operating margin Dollar value. This can occur if product prices rise at the same rate as unit resource price increases, and if volumes drop in the range of -3 to -4%.
The operating profit declined by about -6% from $1,000 to $950. If Ellie’s had matched Heinz’s price increase of 15% and if Ellie’s volume only declined by 3%, then Ellie would have only been able to achieve an operating profit of about $640 in 2022.
Note: In an inflationary environment, the achievement of Dollar profitability levels that matches or that slightly beats previous periods can actually indicate a real decline if you had to adjust the new profit level for its inflationary devaluation impact.
CPG Inflation might moderate in 2023
IRI, NielsenIQ and SPINS use their extensive real-time data sets and advanced analytical tools to forecast and predict pricing and volume changes across and within CPG categories.
Source: Brand Growth: A Playbook for 2023 and Beyond, KK Davey, Ray Florio, IRI Report, Nov 16, 2022
KK Davey and Ray Florio presented and discussed IRI’s 2023 inflation and volume outlook, in an insightful November 2022 webinar that highlighted IRI’s “A Playbook for 2023 and Beyond” report.
The forecast for the US Retail Food and Beverage category is that Dollar Sales will grow 5 - 7 %. This retail sales growth will be derived from a unit price increase (the inflationary component) of 7 - 9% with volume sales stagnation or decline (the elasticity and recessionary impact) between zero and -3%.
The forecasts above are overall food and beverage category weighted averages. Pricing and volume elasticity forecasts will obviously vary for specific food and beverage categories, sub-categories and geographies.
If you are a subscriber to category data from your preferred data syndication provider, this data will be quite useful in allowing you to look at “what if” impact scenarios for your brand. If you are an emerging CPG brand and do not have access to granular data, you can use appropriate assumptions to identify a range of pricing and volume change that will allow you to evaluate the potential impact on your brand and business.
How will a 2023 outlook impact operating profits?
For Ellie’s Farmhouse Ketchup, we will continue the operating profit impact analyses by considering what would happen if we use IRI’s midrange pricing forecast of 8%. Given that ketchup is a center-aisle item and that consumers are shifting purchases to fresher foods where prices have increased less, we will explore two scenarios with the IRI “forecast” of -3% volume reduction and one scenario with the same -4% volume decline that is being experienced so far in 2022.

2023 Operating Profit Impact Scenarios
For 2023, the three scenarios explore the operating profit impact under the following conditions:
Trade marketing expenses that increase from 15% to 16% of gross sales, given the heightened promotional activity that normally accompanies inflationary periods. (This is likely to be higher!.)
COGS, Freight and MG&A unit resource price increases of:
8% that is matched by the 8% SRP increase
10% and 12% which is higher than the 8% SRP increase and which represents a price under-recovery situation.
The operating profit impact of the three scenarios is displayed in the graphic above. Key observations include the following:
Product price increases that are at parity with or below the overall increase in COGS, freight and MG&A unit resource price increases, and where volumes also decline will likely result in a decline in operating profit.
An increase in trade marketing expenses as a % of gross sales, as a competitive inflationary period response to try claw back volume, decreases the net price which further exacerbates the operating profit decline.
Brands with low single-digit (or negative) operating margin % of net sales are more susceptible to larger net operating profit declines as price under-recovery increases and as volume declines get larger.
For Ellie’s Farmhouse Ketchup a 8% price increase, a 12% cost increase and an increase of trade marketing expenses to 16% of gross sales will yield a decline in operating profit from $950 in 2022 to -$260 in 2023. That is a reduction in operating profit by about -127%.
What this case study illustrates is that…
...Even if inflation moderates from 2022 (17% to 8%), as IRI is forecasting, and even if volume declines are in the low single digit ranges, the potential for significant operating profit declines remains high if the increase in unit resource prices exceeds the increase in product prices due to persistent cost input inflation.
The ability to achieve price over-recovery or an acceptable price under-recovery level is dependent on shopper’s and consumer’s willingness to pay. Hermann and Echter, express the challenge of the reality of price under-recovery succinctly:
“Cost increases without corresponding increases in customers’ willingness-to-pay inevitably lead to a profit decline.”
(Hermann Simon & Adam Echter; Beating Inflation; Springer International Publishing, Nov 2022)
The larger dilemma, as Hermann and Echter assert, is that the current inflationary period will persist for a number of years. So, even if inflation moderates each year, the ongoing potential combination of price under-recovery, volume declines and aggressive promotion activity will continue to pressurize operating profits.
For emerging CPG brands and/or CPG brands with low single digit operating margin % of net sales, the current inflationary period will voraciously consume cashflow and potentially put the brands at viability risk.
Doubling down on resource efficiency
Unless you adopt an acquisition strategy to bolster earnings depleted through what is likely going to be a prolonged period of price under-recovery and recessionary volume declines, this is a good time to start doubling-down on efficiency and productivity efforts.
While it’s never too late to start, meaningful and sustainable efficiency improvements can take between 12 to 18 months before results can start bearing fruit. Those companies and brands that have a culture of improvement and that started prior to COVID will have a competitive edge.
Accelerated and bold efficiency improvements offer a company and its brands the ability to mitigate year-on-year operating profit declines. Importantly, resource efficiency improvements can restore operating profit growth to pre-inflation growth trajectory levels.
What do we mean by resource efficiency in the context of inflation and this article?
Resource efficiency is a measure of the organization’s ability to decrease (or increase) the quantity of input cost resources at a SLOWER rate than the decrease (or increase) of the product quantities processed, stored and sold.
Input cost resources are the variable and fixed resource unit quantities that are consumed or utilized in developing, manufacturing, storing, shipping, administering, marketing and promoting quality products to shoppers and consumers.
Efficiency improvement for Ellie’s Farmhouse Kitchen implies that even though volumes are likely to decline due to elasticity and recessionary dynamics, Ellie’s will have to find ways to reduce the consumption or usage of variable and fixed resources at a faster rate. This means that Ellie’s will have to use less materials, less labour, less freight “units”, less storage space or time and less overhead units for every product that is produced, stored and sold.
What level of resource efficiency improvement does Ellie’s have to achieve to mitigate price under-recovery and a -4% volume declines?
To achieve an operating profit of $1,100 in 2023 that will show some real growth (inflation adjusted) over the $950 level of 2022, Ellies would have to improve COGS and freight resource efficiency levels by 5% and MG&A resource efficiency levels by 11%.
Note: COGS, Freight and MG&A unit resource prices have increased by 12% for this scenario. But, COGS and freight quantities have also decreased from 2022 to 2023 in line with volume elasticity and recessionary-related declines. Resource efficiency improvement is about using less resource units per unit of product quantity produced!

2023 COGS, Freight and MG&A Resource Improvement Efficiencies to Mitigate Price Under-recovery and Volume Declines
The impact on low operating-margin brands is larger
Ellie’s Farmhouse Ketchup is illustrative of an emerging brand that, in 2021, was operating at a 5% operating profit of net sales level. Without improving COGS, freight and overhead efficiencies, Ellie’s would be placed in negative profitability territory for 2023.
Brands and companies with operating margins that are below 5% or that are in -ve margin percentage territory are not normally able to reach and recover their previous profitability level if
Product prices increases that match unit resource price increases, and if
Elasticity and recessionary based volume declines are exhibited.
For brands with low operating margins, price recovery and volume elasticity impacts within certain ranges will have a much larger impact on the size of the change in operating profit Dollars from 2022 to 2023.
Why does this occur? This change amplification dynamic for low operating margin brands occurs due to a) the smaller profitability base that a price-volume change impacts and b) the manner in which unit price and volume economics work.
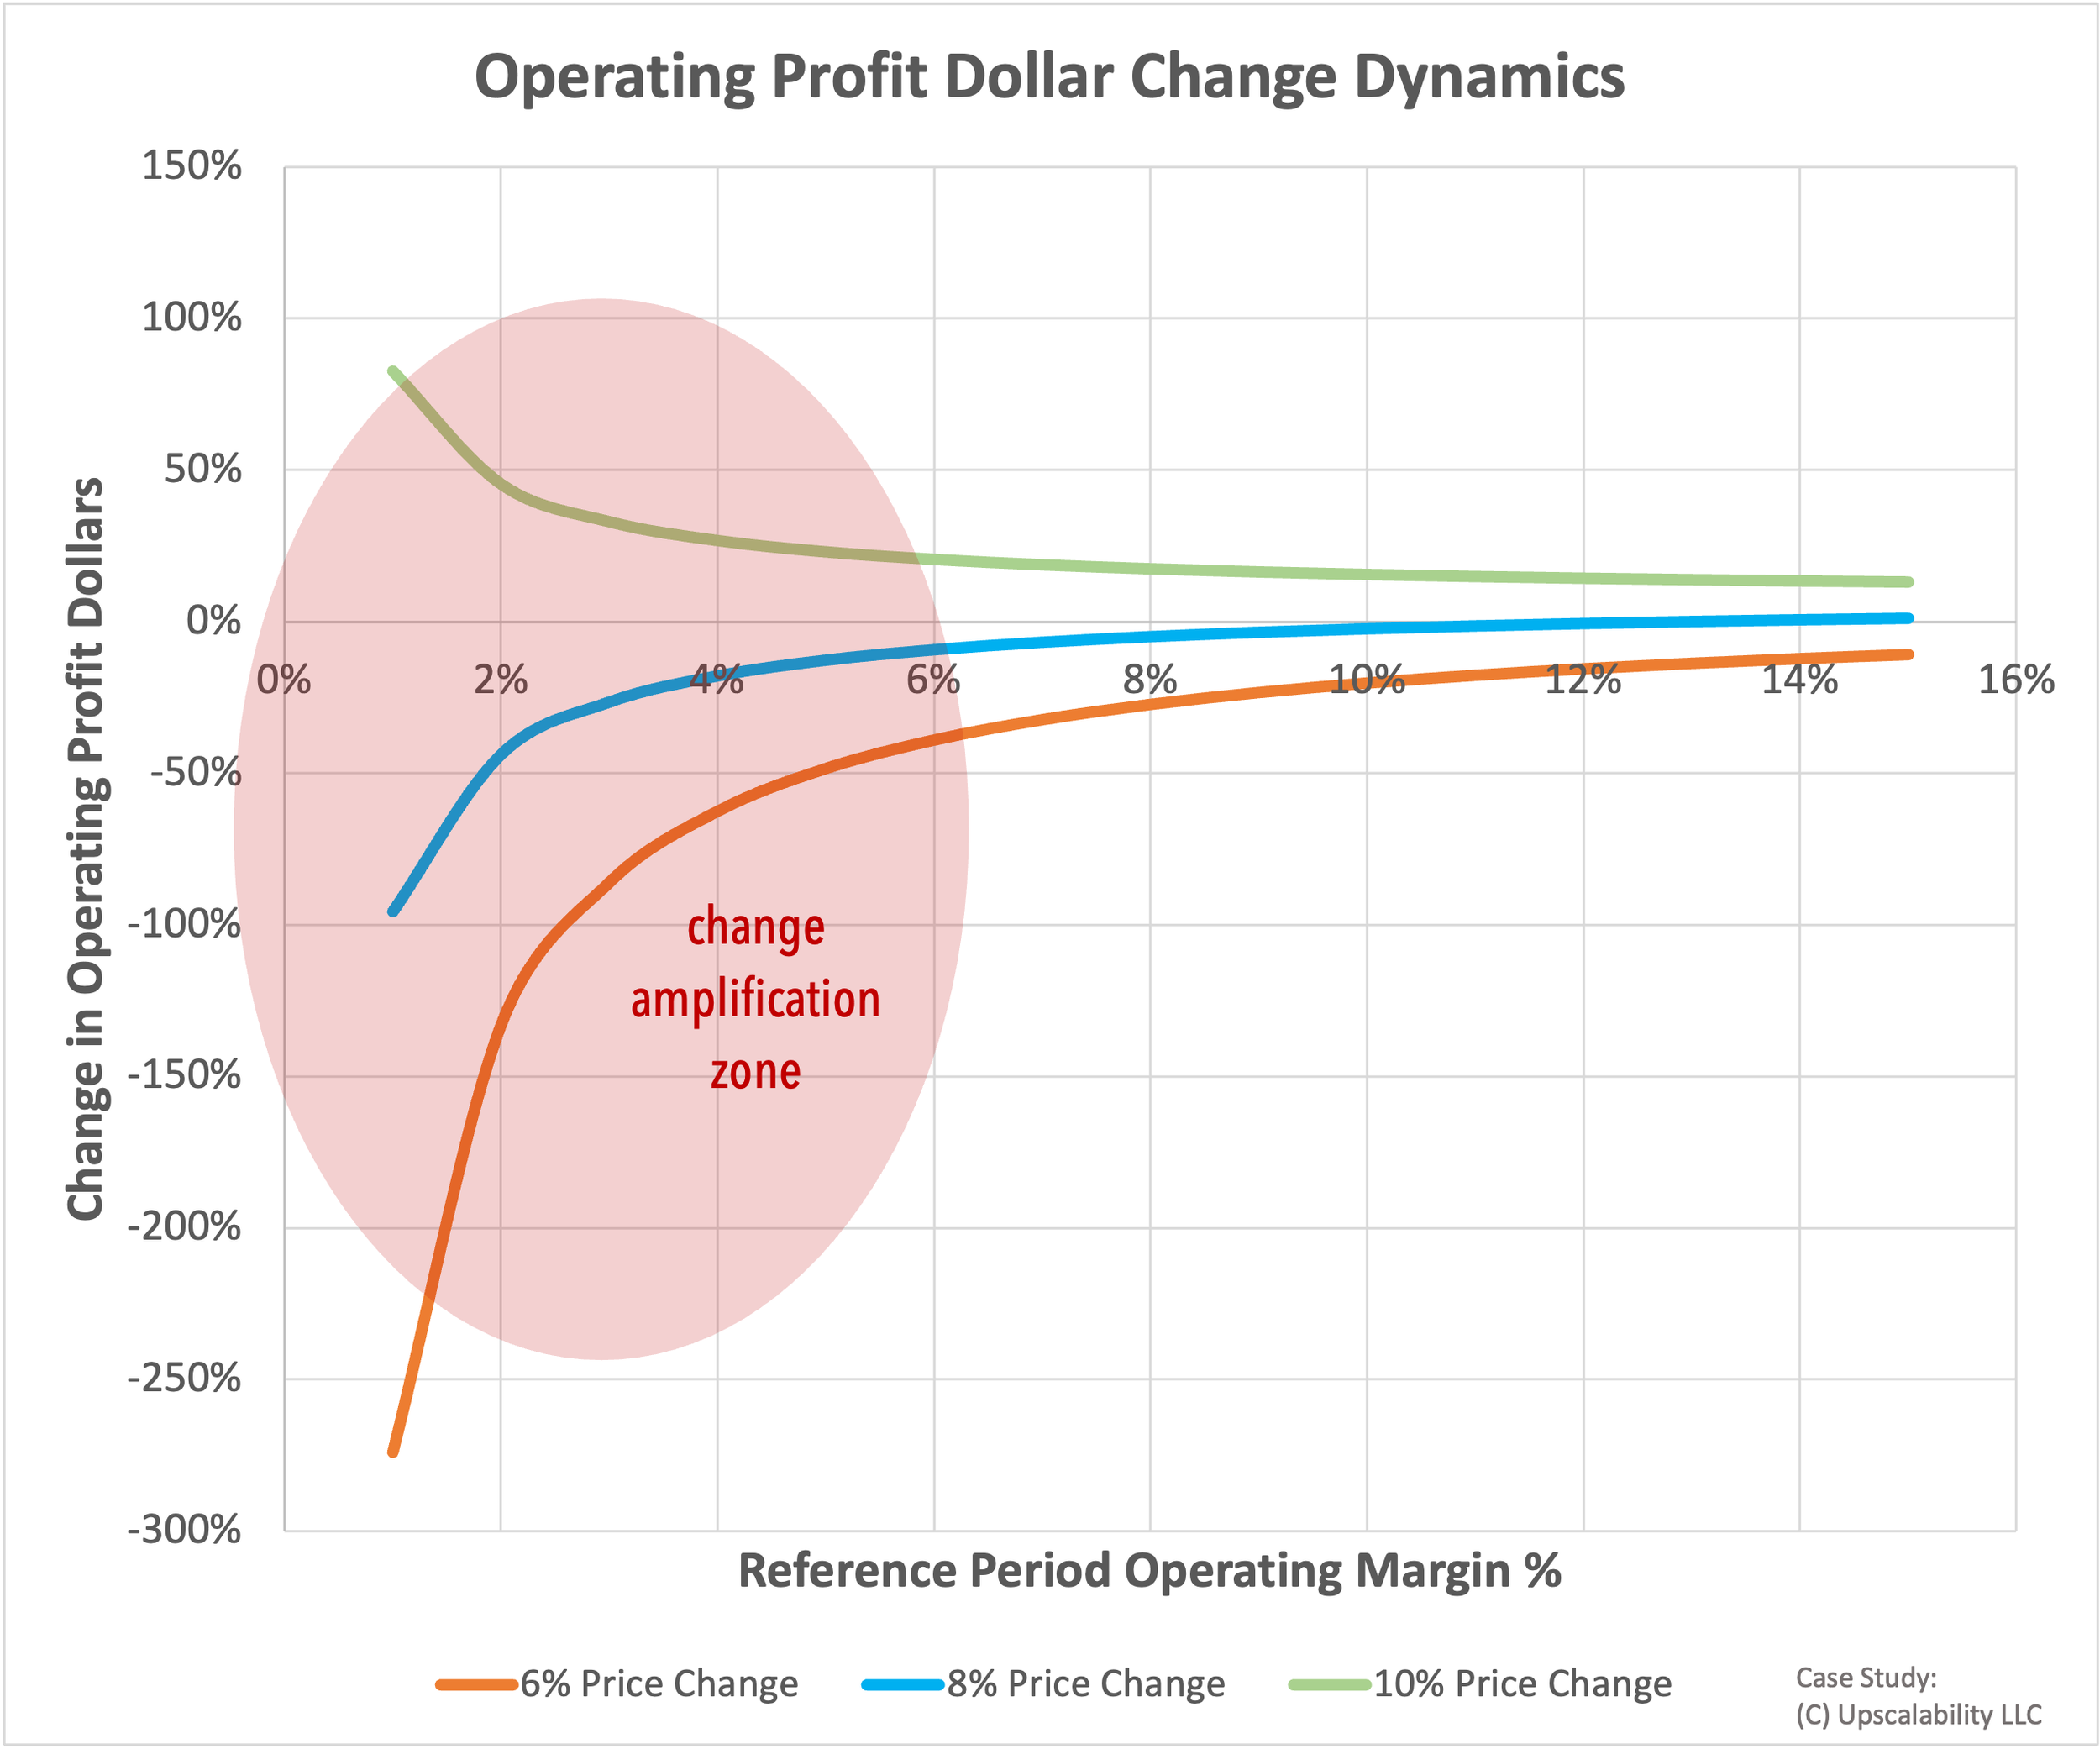
This phenomena is highlighted and visualized in the chart alongside where the curves represent the extent of operating profit Dollar change over two periods for different operating margins as a % of net sales (the x-axis) :
Green curve: Price over-recovery (10% product price increase vs 8 % unit resource price increase)
Blue curve: Price recovery (8% product price increase vs 8 % unit resource price increase)
Orange curve: Price under-recovery (6% product price increase vs 8 % unit resource price increase)
A -4% volume decline is present for all three price recovery situations in the chart.
This is why many startup and emerging CPG brands, which normally have low operating margin percentages, bear the brunt of inflationary periods and are at increased risk of failure.
However, the change amplification zone is not just critical for emerging CPG brands. Large incumbent brands with a low operating margin % are also subject to these dynamics.
A key driver for the unit economic changes depicted in the chart and in the case study is related to the higher leveraging power that a price increase or decrease has on margins versus an equivalent increase in volume. This dynamic, or profit multiplier effect as it is called by Hermann Simon (or profit dampener if pricing decreases) will be covered in more detail in a future article. (Subscribe here for it to be delivered directly to your inbox)
Note 1: Brands with high operating margins are also impacted, just by relatively smaller changes in operating margin Dollars. However even smaller changes over a large base of operating profit Dollars is significant. (The outsize change for low-margin brands “hides” what are still meaningful changes for brands with higher margins.
Note 2: A low operating margin % brand can be a brand that has:
A high gross margin or sales contribution but with a high MG&A overhead structure.
A low gross margin or sales contribution with a low MG&A overhead structure.
A low gross margin or sales contribution with a relatively high MG&A overhead structure.
Product and business model innovation is key
Improving the potential and capability of a brand to raise prices and even reducing elasticity requires that brands also use this inflationary period to accelerate what and how they innovate.
Brands need to introduce and communicate product, packaging, service or go-to-market business model innovations that will increase the perceived value of that brand and therefore the shopper’s and consumer’s willingness to pay.
The perceived value, willingness to pay and innovation drivers are fundamental aspect of pricing as researched and advocated by Hermann Simon and Adam Echter of Simon-Kucher & Partners.
Over a prolonged inflationary periods, smart value enhancements as perceived by shoppers and consumers can have the effect of increasing price recovery prospects and can help improve resource efficiencies that can restore and even beat previous profitability trajectories on an inflation-adjusted basis.
Managing Inflation is about managing trade-offs
If you extend the type of “simple” analyses illustrated in this case study over a few annual periods, you can understand how companies (in unison with other brand-owners and retailers) are more than likely to continue pulling the pricing lever each year. This is deemed necessary in the efforts to mitigate volume losses and in the pursuit of trying to return companies and brands to bottom-line growth.
Even, if CPG price increases subside from a prevailing 12-15% rate to a range of 7-9%, these annualized increases are here to stay for a few years. How established and emerging CPG brands manage pricing and resource trade-offs will determine whether they will survive or fail.
Charlotte Rogers off Marketing Week, highlights the challenge in her Dec 2022 article, as expressed by marketing effectiveness and econometrics wizard, Les Binet of Adam&eveDDB.
"Optimizing price is the “number one” priority for marketers in the current inflation crisis."
(Charlotte Rogers; Les Binet: Optimising price is the first frontier in the fight against inflation; MarketingWeek; Dec 2, 2022)
The Ellie’s Farmhouse Ketchup case study highlights and illustrates the role and impact that price recovery and resource efficiency plays especially during inflationary periods.
The bottom line, pun intended, is that emerging and established CPG brands will be able to maintain and strengthen their competitive during this prolonged inflationary period by adopting a deliberate price under-recovery approach (to pressurize competitors) that is financed by sustainable resource efficiency improvements. It is a supply-chain wide call to to action that requires fundamental cultural buy-in and action.

Charting viable pathways in uncertain times
Emerging CPG brands do not always have access to the resources that would allow them to charter and execute better plans in these uncertain times. If you are a steward of an emerging CPG brand it is recommended that you pre-empt inflationary surprises and challenges by working with your CFO to conduct a similar analyses as that shown for Ellie’s Farmhouse Kitchen. If you need some help and direction with some kwik ‘n dirty (and cost effective) approaches that have been used, please send me a note.
Large and established CPG companies perform sophisticated price and volume elasticity analyses to drive decisions. If you are a steward of an established CPG brand, it might be helpful to enhance your current “what if” decision-making tools by reframing and mapping your brand and SKU performance using the unique Price Recovery and Efficiency advanced analytics and accounting approach.
Please share this article if it was useful. I will be publishing more CPG margin growth, pricing and velocity perspectives and insights on a “regular-irregular” basis. You can sign-up here for those articles to be delivered directly to your inbox.
Manoli Kulutbanis